Areas · October 2026
Property prices in Egypt by areaأسعار العقارات في مصر حسب المنطقة
On we priced 4,832 new-build homes unit by unit in 428 compounds: the national median is 93,409 EGP/m², and across the 22 areas with 3+ compounds and 30+ units the area median runs from 53,272 in New Capital City to 194,300 in Somabay. The biggest market is New Capital City (765 units); homes start from 1.7M EGP.
Apartment prices in older districts: Maadi, Nasr City, Mohandessin, Smouha and more →
Property prices in all 26 areas, side by side
Every area with at least 10 new-build units on 31 October 2026, largest market first. Per m² is the median asking price per square metre; the national median is 93,409 EGP/m². Tap a column heading to sort.
| Area | Units | Compounds | From (EGP) | Median (EGP) | Per m² (EGP) | vs national | Longest plan | Lowest down | Ready by 2026 | More |
|---|---|---|---|---|---|---|---|---|---|---|
| New Capital City | 765 | 55 | 2.1M | 9.9M | 53,272 | −43% | 15 yrs | 1.2% | 10% | m² · prices · guide |
| New Cairo | 621 | 65 | 2.4M | 13.1M | 90,751 | −3% | 12 yrs | 1.5% | 4% | m² · prices · guide |
| Ras El Hekma | 439 | 47 | 6.1M | 24.6M | 164,053 | +76% | 12 yrs | 2.5% | 3% | m² · prices · guide |
| Mostakbal City | 320 | 22 | 3M | 14.6M | 85,046 | −9% | 12 yrs | 0.1% | 6% | m² · prices · guide |
| 6th settlement | 316 | 25 | 2.4M | 10.9M | 70,688 | −24% | 14 yrs | 0.5% | 0% | m² · prices · guide |
| New Zayed | 311 | 27 | 4.8M | 22.6M | 123,418 | +32% | 15 yrs | 2.5% | 11% | m² · prices · guide |
| El Sheikh Zayed | 292 | 22 | 2.4M | 16M | 100,358 | +7% | 12 yrs | 1% | 2% | m² · prices · guide |
| October Gardens | 266 | 23 | 2M | 12.1M | 94,148 | +1% | 12 yrs | 1.5% | 5% | m² · prices · guide |
| 6th of October City | 244 | 26 | 1.7M | 13.7M | 96,214 | +3% | 12 yrs | 2.5% | 1% | m² · prices · guide |
| Al Alamein | 198 | 13 | 1.7M | 9.6M | 55,962 | −40% | 12 yrs | 5% | 39% | m² · prices · guide |
| Ain Sokhna | 157 | 16 | 1.7M | 11.4M | 99,800 | +7% | 10 yrs | 5% | 10% | m² · prices · guide |
| Northern Expansion | 144 | 8 | 5.8M | 14.3M | 86,254 | −8% | 12 yrs | 1.5% | 1% | m² · prices · guide |
| Al Dabaa | 93 | 12 | 3.9M | 20.3M | 169,914 | +82% | 15 yrs | 1.5% | 14% | m² · prices · guide |
| Sidi Abdel Rahman | 88 | 8 | 4.5M | 14.6M | 112,728 | +21% | 12 yrs | 5% | 1% | m² · prices · guide |
| New Heliopolis | 65 | 4 | 4.5M | 15.7M | 96,826 | +4% | 15 yrs | 4.5% | 11% | m² · prices · guide |
| El Shorouk | 58 | 8 | 5.8M | 14.8M | 77,390 | −17% | 10 yrs | 5% | 22% | m² · prices · guide |
| North Investors | 49 | 6 | 4M | 20.8M | 110,965 | +19% | 8 yrs | 5% | 18% | m² · prices · guide |
| Sidi Heneish | 47 | 4 | 4.8M | 20.6M | 127,020 | +36% | 12 yrs | 5% | 0% | m² · guide |
| Somabay | 46 | 7 | 14.5M | 23.2M | 194,300 | +108% | 8 yrs | 5% | 13% | m² · guide |
| Alexandria thin sample | 45 | 2 | 9.3M | 17.1M | 94,739 | +1% | 10 yrs | 5% | 0% | guide |
| El Lotus | 42 | 4 | 5M | 15M | 89,222 | −4% | 10 yrs | 5% | 0% | m² · prices · guide |
| Makadi | 42 | 4 | 7.8M | 17.9M | 167,254 | +79% | 8 yrs | 10% | 0% | m² · guide |
| New Capital Gardens thin sample | 32 | 1 | 5.5M | 9.7M | 92,399 | −1% | 14 yrs | 2% | 0% | guide |
| South Investors | 31 | 5 | 3.2M | 18.3M | 113,544 | +22% | 10 yrs | 2.5% | 26% | m² · guide |
| Ras Sudr thin sample | 23 | 1 | 3.3M | 3.7M | 40,778 | −56% | 9 yrs | 10% | 0% | guide |
| South New Cairo thin sample | 13 | 2 | 12.4M | 22.2M | 124,643 | +33% | 7 yrs | 10% | 8% | guide |
Like one of these? Ask on WhatsApp for today’s price and availability
Which areas are cheapest per m²?
The 10 areas with the lowest median price per m² on 31 October 2026, among the 22 with at least 3 compounds and 30 units. The cheapest is New Capital City at 53,272 EGP/m²; the dearest are Somabay (194,300), Al Dabaa (169,914), Makadi (167,254) EGP/m². A low per-m² figure can come with larger units, so check the entry price too.
| # | Area | Per m² (EGP) | vs national | From (EGP) | Units | Per-m² page |
|---|---|---|---|---|---|---|
| 1 | New Capital City | 53,272 | −43% | 2.1M | 765 | Per m² in New Capital City |
| 2 | Al Alamein | 55,962 | −40% | 1.7M | 198 | Per m² in Al Alamein |
| 3 | 6th settlement | 70,688 | −24% | 2.4M | 316 | Per m² in 6th settlement |
| 4 | El Shorouk | 77,390 | −17% | 5.8M | 58 | Per m² in El Shorouk |
| 5 | Mostakbal City | 85,046 | −9% | 3M | 320 | Per m² in Mostakbal City |
| 6 | Northern Expansion | 86,254 | −8% | 5.8M | 144 | Per m² in Northern Expansion |
| 7 | El Lotus | 89,222 | −4% | 5M | 42 | Per m² in El Lotus |
| 8 | New Cairo | 90,751 | −3% | 2.4M | 621 | Per m² in New Cairo |
| 9 | October Gardens | 94,148 | +1% | 2M | 266 | Per m² in October Gardens |
| 10 | 6th of October City | 96,214 | +3% | 1.7M | 244 | Per m² in 6th of October City |
Where are the longest payment plans and the lowest down payments?
Areas ranked by the typical (median) plan length on a unit, then the typical lowest down payment (31 October 2026). The longest single plan listed is 15 years in New Capital City; the lowest down payment listed is 0.1%, in Mostakbal City.
| Area | Typical plan | Longest plan | Typical down | Lowest down | Units |
|---|---|---|---|---|---|
| Al Alamein | 12 yrs | 12 yrs | 5% | 5% | 198 |
| New Capital City | 10 yrs | 15 yrs | 5% | 1.2% | 765 |
| New Cairo | 10 yrs | 12 yrs | 5% | 1.5% | 621 |
| Mostakbal City | 10 yrs | 12 yrs | 5% | 0.1% | 320 |
| 6th settlement | 10 yrs | 14 yrs | 5% | 0.5% | 316 |
| New Zayed | 10 yrs | 15 yrs | 5% | 2.5% | 311 |
| 6th of October City | 10 yrs | 12 yrs | 5% | 2.5% | 244 |
| Northern Expansion | 10 yrs | 12 yrs | 5% | 1.5% | 144 |
| New Heliopolis | 10 yrs | 15 yrs | 5% | 4.5% | 65 |
| Al Dabaa | 10 yrs | 15 yrs | 10% | 1.5% | 93 |
East vs West Cairo vs New Capital vs the coast: how do they compare?
The same figures grouped the way buyers shortlist (31 October 2026): New Capital: 53,272 EGP/m², from 2.1M EGP; East Cairo (New Cairo side): 87,122 EGP/m², from 2.4M EGP; West Cairo: 103,158 EGP/m², from 1.7M EGP; North Coast: 138,667 EGP/m², from 1.7M EGP. Each group pools the units of its areas in the table above.
| Region | Areas | Units | Compounds | From (EGP) | Median (EGP) | Per m² (EGP) | vs national | Typical plan | Ready by 2026 |
|---|---|---|---|---|---|---|---|---|---|
| New Capital | 1 | 765 | 55 | 2.1M | 9.9M | 53,272 | −43% | 10 yrs | 10% |
| East Cairo (New Cairo side) | 9 | 1515 | 141 | 2.4M | 13.5M | 87,122 | −7% | 10 yrs | 5% |
| West Cairo | 5 | 1257 | 106 | 1.7M | 15.9M | 103,158 | +10% | 10 yrs | 5% |
| North Coast | 5 | 865 | 84 | 1.7M | 17.9M | 138,667 | +48% | 10 yrs | 12% |
| Red Sea | 3 | 245 | 27 | 1.7M | 15.4M | 121,795 | +30% | 8 yrs | 9% |
| Cairo and Alexandria | 1 | 45 | 2 | 9.3M | 17.1M | 94,739 | +1% | 9 yrs | 0% |
Which areas have the most homes ready to move into?
Share of new-build units with a stated date that are ready or due by the end of 2026 (31 October 2026); nationally 340 of 4,832 (7%). Areas need 30 dated units for this table.
| Area | Ready units | Units with a date | Share | Ready from (EGP) |
|---|---|---|---|---|
| Al Alamein | 77 | 198 | 39% | 3.2M |
| South Investors | 8 | 31 | 26% | 13.7M |
| El Shorouk | 13 | 58 | 22% | 17.2M |
| North Investors | 9 | 49 | 18% | 22.4M |
| Al Dabaa | 13 | 93 | 14% | 4.3M |
| Somabay | 6 | 46 | 13% | 23.5M |
| New Zayed | 34 | 311 | 11% | 15.9M |
| New Heliopolis | 7 | 65 | 11% | 11.3M |
| New Capital City | 76 | 765 | 10% | 4.1M |
| Ain Sokhna | 15 | 157 | 10% | 11.2M |
How we got these numbers: asking prices of 4832 new-build units in 428 compounds, as listed in October 2026. Resale units are excluded. Units under 1M EGP or under 15,000 EGP/m² are dropped as likely listing errors. Prices change; confirm with the developer before you decide.
Areas need at least 10 new-build units for a row; rankings, headline ranges and FAQs count only areas with 3+ compounds and 30+ units (others are marked thin sample). Lowest down payment ignores 0% listings; typical plan and down payment are medians per unit; ready means a stated delivery year of 2026 or earlier.
Frequently asked
What is the average price per m² in Egypt in 2026?
A median 93,409 EGP/m² across 4,832 new-build units in 428 compounds on 31 October 2026, from 53,272 EGP/m² in New Capital City to 194,300 EGP/m² in Somabay.
What is the cheapest area to buy property in Egypt?
Per m²: New Capital City (53,272 EGP/m²), Al Alamein (55,962 EGP/m²), 6th settlement (70,688 EGP/m²). The lowest entry price is 1.7M EGP (85 m² at Mini Egypt, Ain Sokhna) (31 October 2026).
What is the most expensive area in Egypt per m²?
Somabay at a median 194,300 EGP/m² (+108% against the national median), followed by Al Dabaa (169,914), Makadi (167,254) (31 October 2026).
Which area in Egypt has the most new compounds for sale?
New Capital City: 765 new-build units in 55 compounds, from 2.1M EGP and 53,272 EGP/m²; next are New Cairo (621 units), Ras El Hekma (439 units) (31 October 2026).
Which area in Egypt has the longest payment plans?
Al Alamein, where the typical plan runs 12 years (up to 12) with a typical 5% down; the longest single plan listed anywhere is 15 years in New Capital City (31 October 2026).
Is East Cairo or West Cairo cheaper?
Per m², East Cairo (New Cairo side) has a median 87,122 EGP/m², West Cairo 103,158 EGP/m² and New Capital 53,272 EGP/m², against 93,409 nationally (31 October 2026).
All 27 areas
 New Capital City
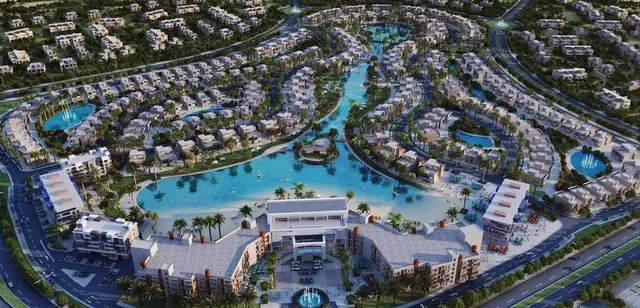 New Cairo
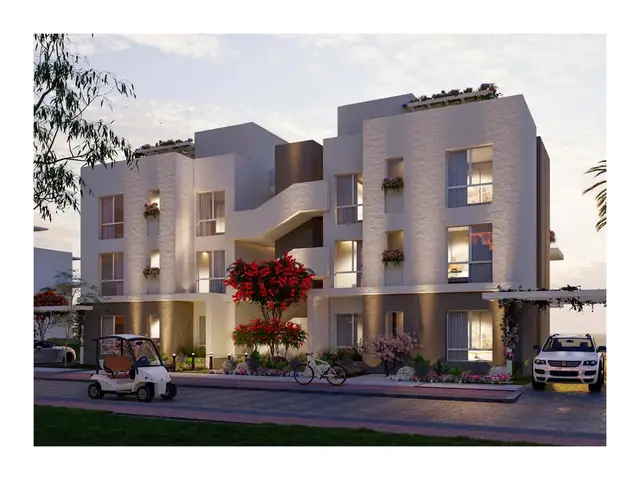 Ras El Hekma
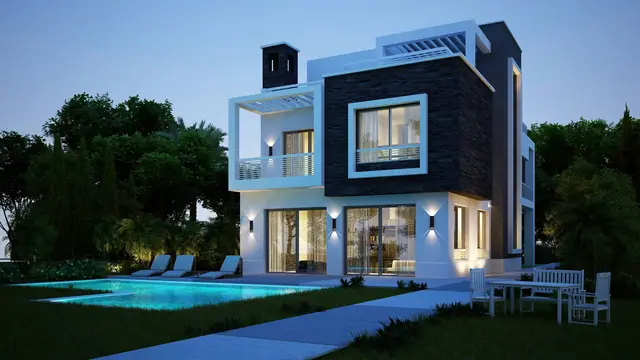 6th of October City
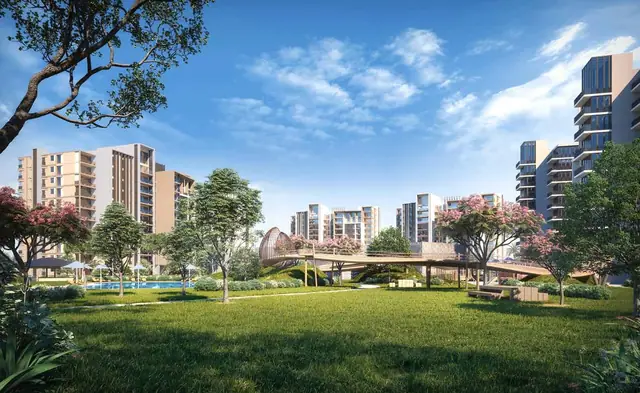 El Sheikh Zayed
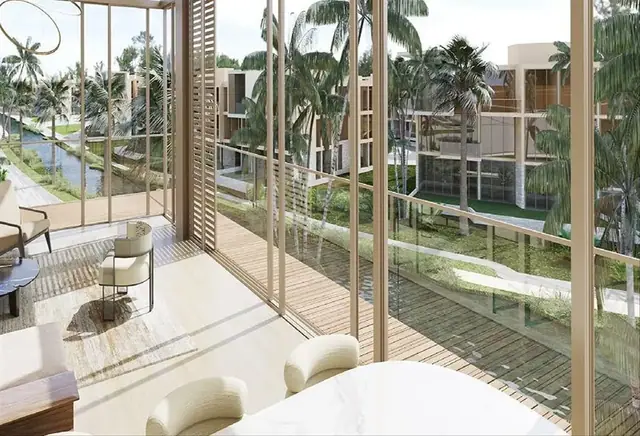 New Zayed
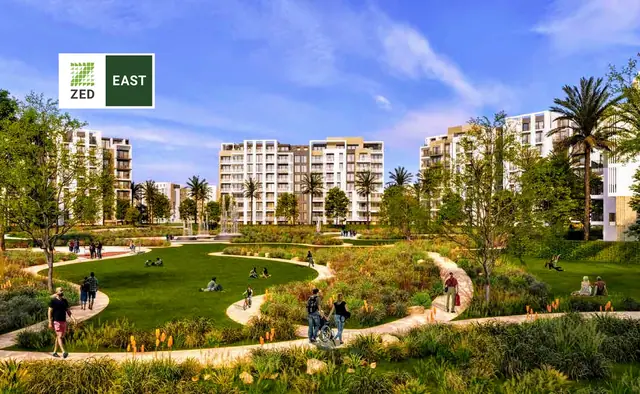 6th settlement
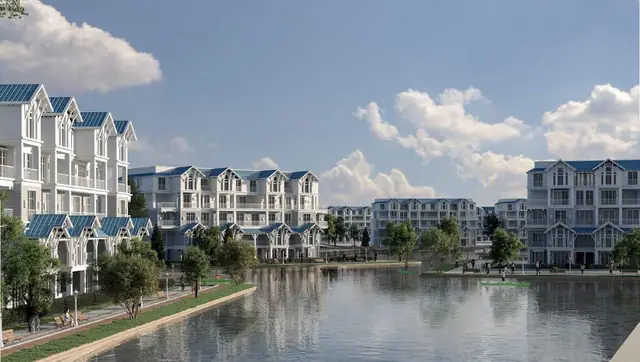 Mostakbal City
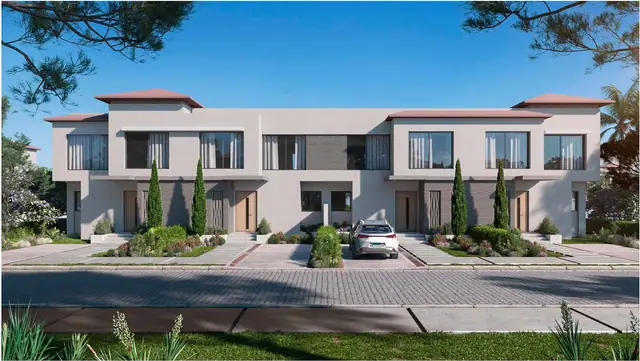 October Gardens
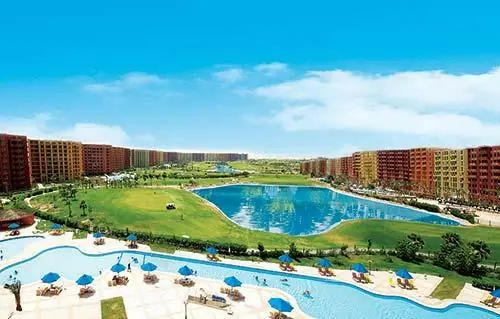 Al Alamein
 Ain Sokhna
 Northern Expansion
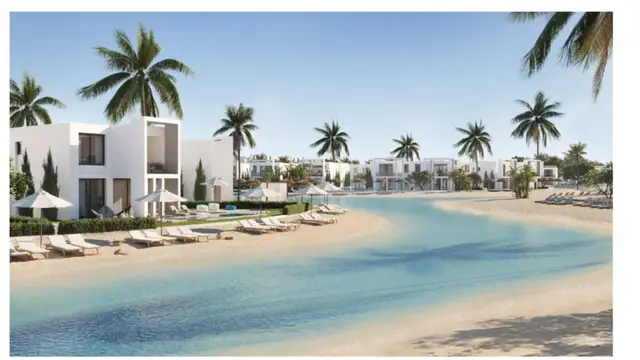 Al Dabaa
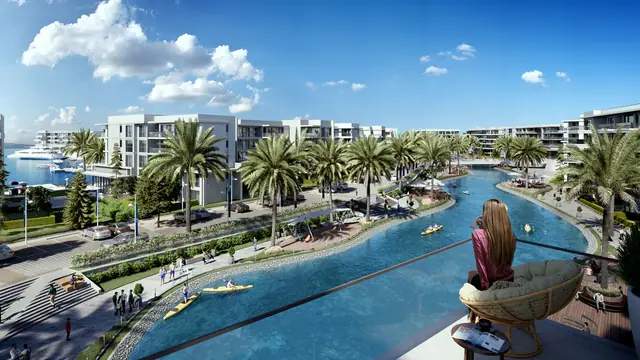 Sidi Abdel Rahman
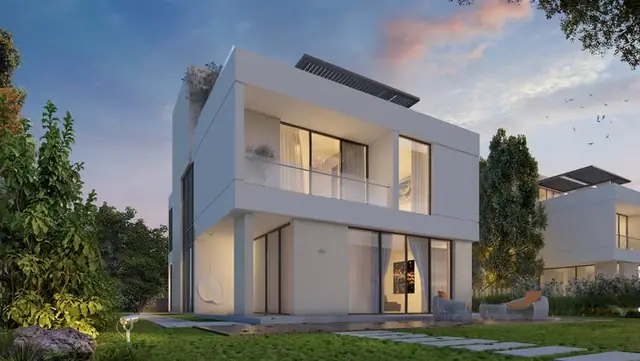 El Shorouk
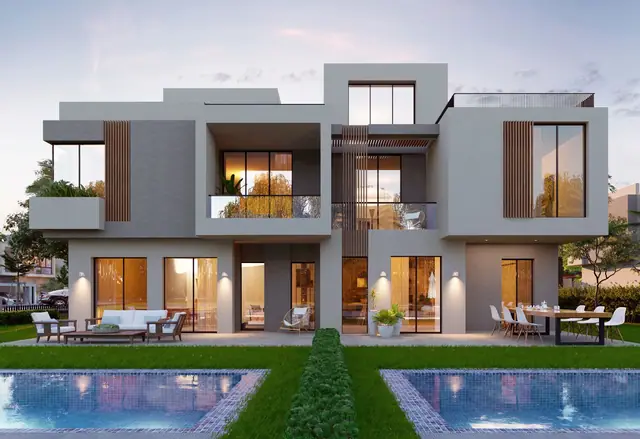 New Heliopolis
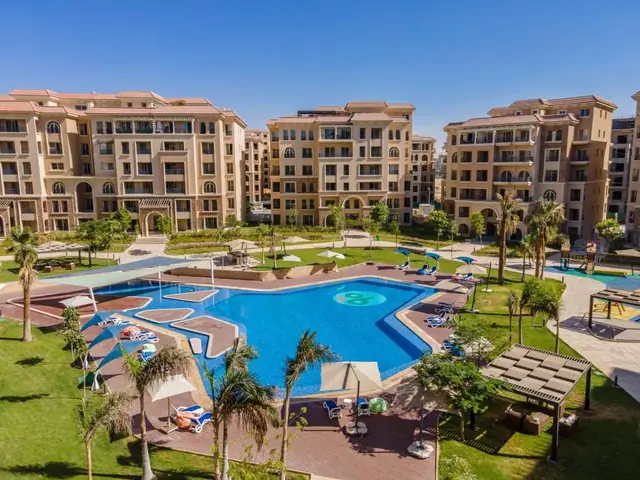 North Investors
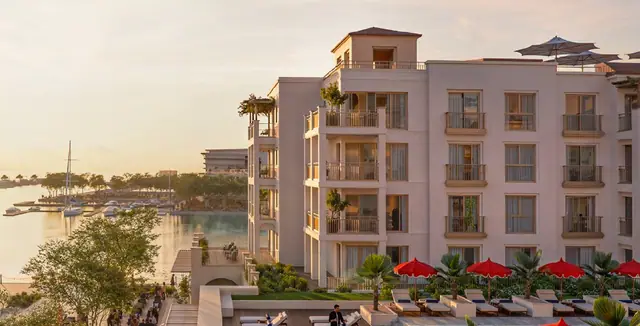 Somabay
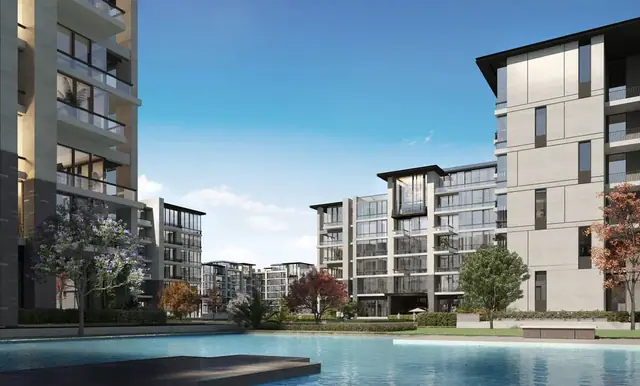 El Lotus
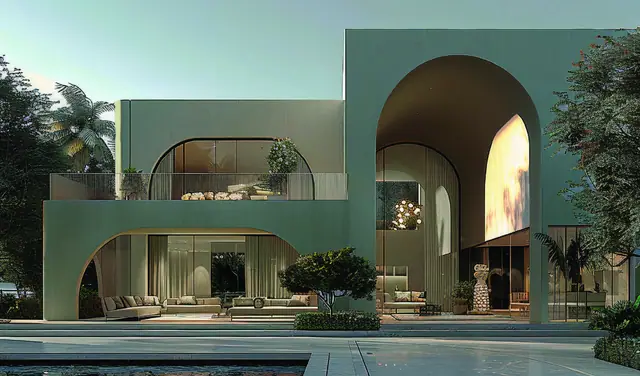 Sidi Heneish
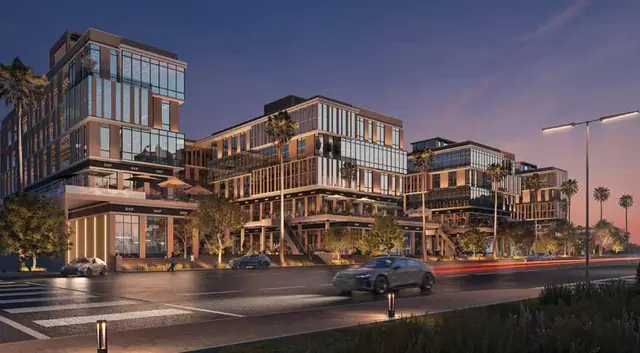 South Investors
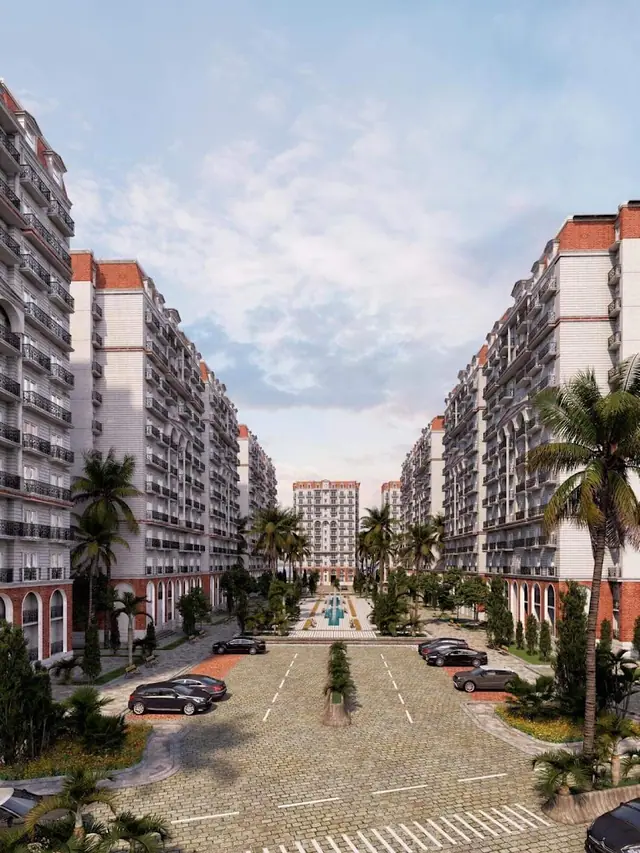 Alexandria
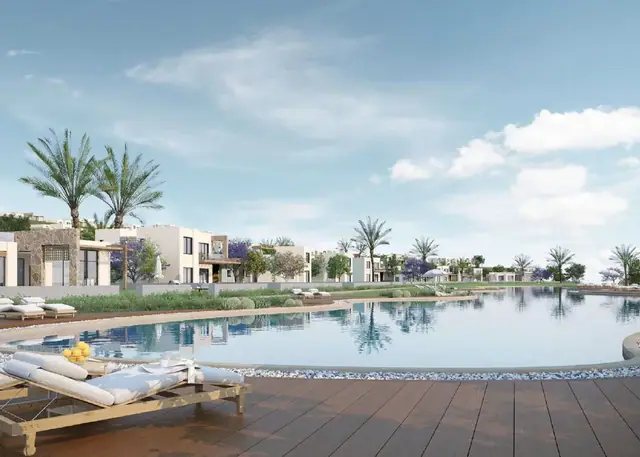 Makadi
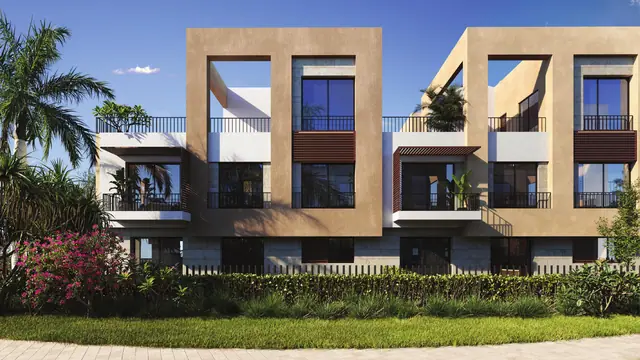 South New Cairo
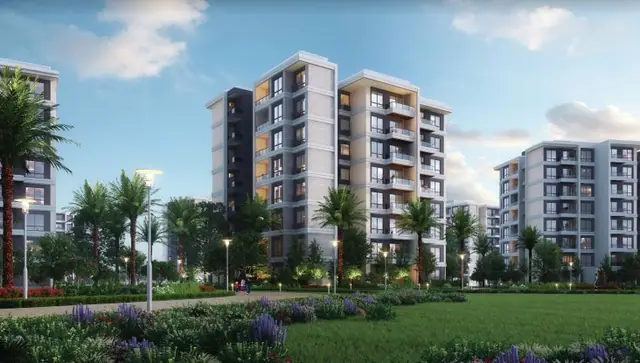 New Capital Gardens
 Ras Sudr
 Old Cairo